
Marijuana Stocks And Chart Patterns; Know The Basics

Technical analysis is a magical thing because it can be applied to any stock in any sector, including marijuana stocks. These pot stocks have had a lot of focus placed on them due to the uncertainties surrounding them. This includes actual sales figures as well as its legality in places like the US.
Another aspect is how marijuana stock news for one company can impact the entire sector. If Aurora was to report bad earnings in a quarter the marijuana sector as a whole may take a massive hit.
[Read More] What To Know When Investing In Marijuana Stocks
But then you have the opposite occur where a market leader can report favorable results, which may act as a bullish catalyst for the cannabis sector. There are so many ways to apply technical analysis to cannabis stocks. Here are a few chart patterns that could help identify some pot stocks to watch in the future:
Marijuana Stock Chart Pattern #1: The Flag
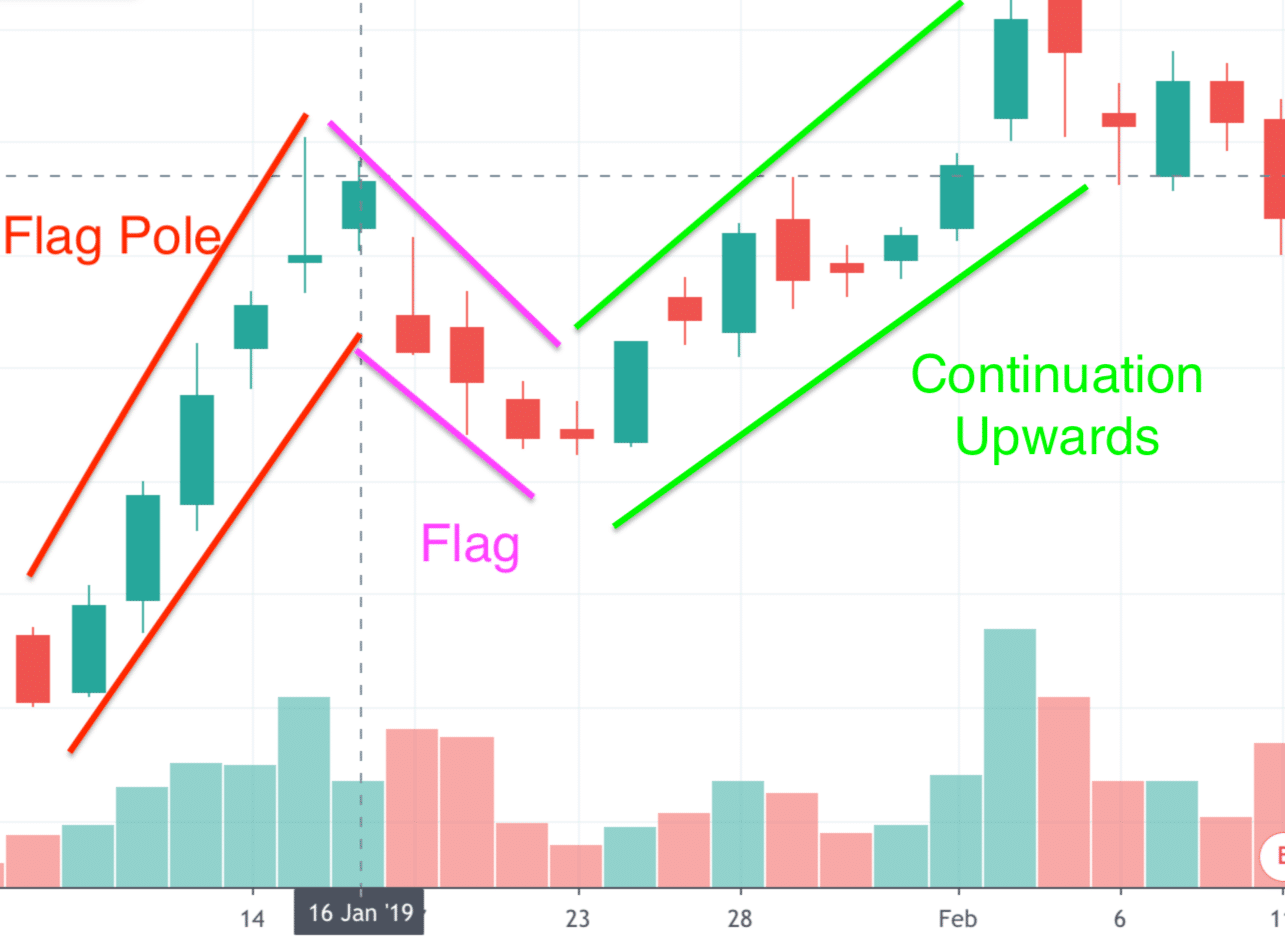
The image above is an example of a picture-perfect bull flag pattern on Aurora’s (ACB Stock Report) stock chart. As you can see, the marijuana stock’s price shot up initially and formed the flagpole. It is essential that there is strong volume backing this move.
The cannabis stock then proceeds to consolidate and form the flag portion. From there, the pot stock breaks out and continues its move upwards as higher trading volumes come in.
This pattern can also be used to detect a continuation downwards. This is known as a bear flag and is simply a flipped over bull flag. If this pattern is seen, you may want to look for good spots to exit your trade. Traditionally, heavy selling pressure is likely inbound. I say “traditionally” because the market itself isn’t a textbook and outside factors (like news) can “change the rules” for technical patterns.
Marijuana Stock Chart Pattern #2: The Double Top / Double Bottom
Unlike flag patterns, double top or bottom patterns detect trend reversals, not a continuation. In Canopy Growth Corporation’s (CGC Stock Report) stock chart you can see that the price has trouble twice breaking the $52 resistance line. The first time it got rejected the cannabis stock was able to hold at $40 before making another push upwards.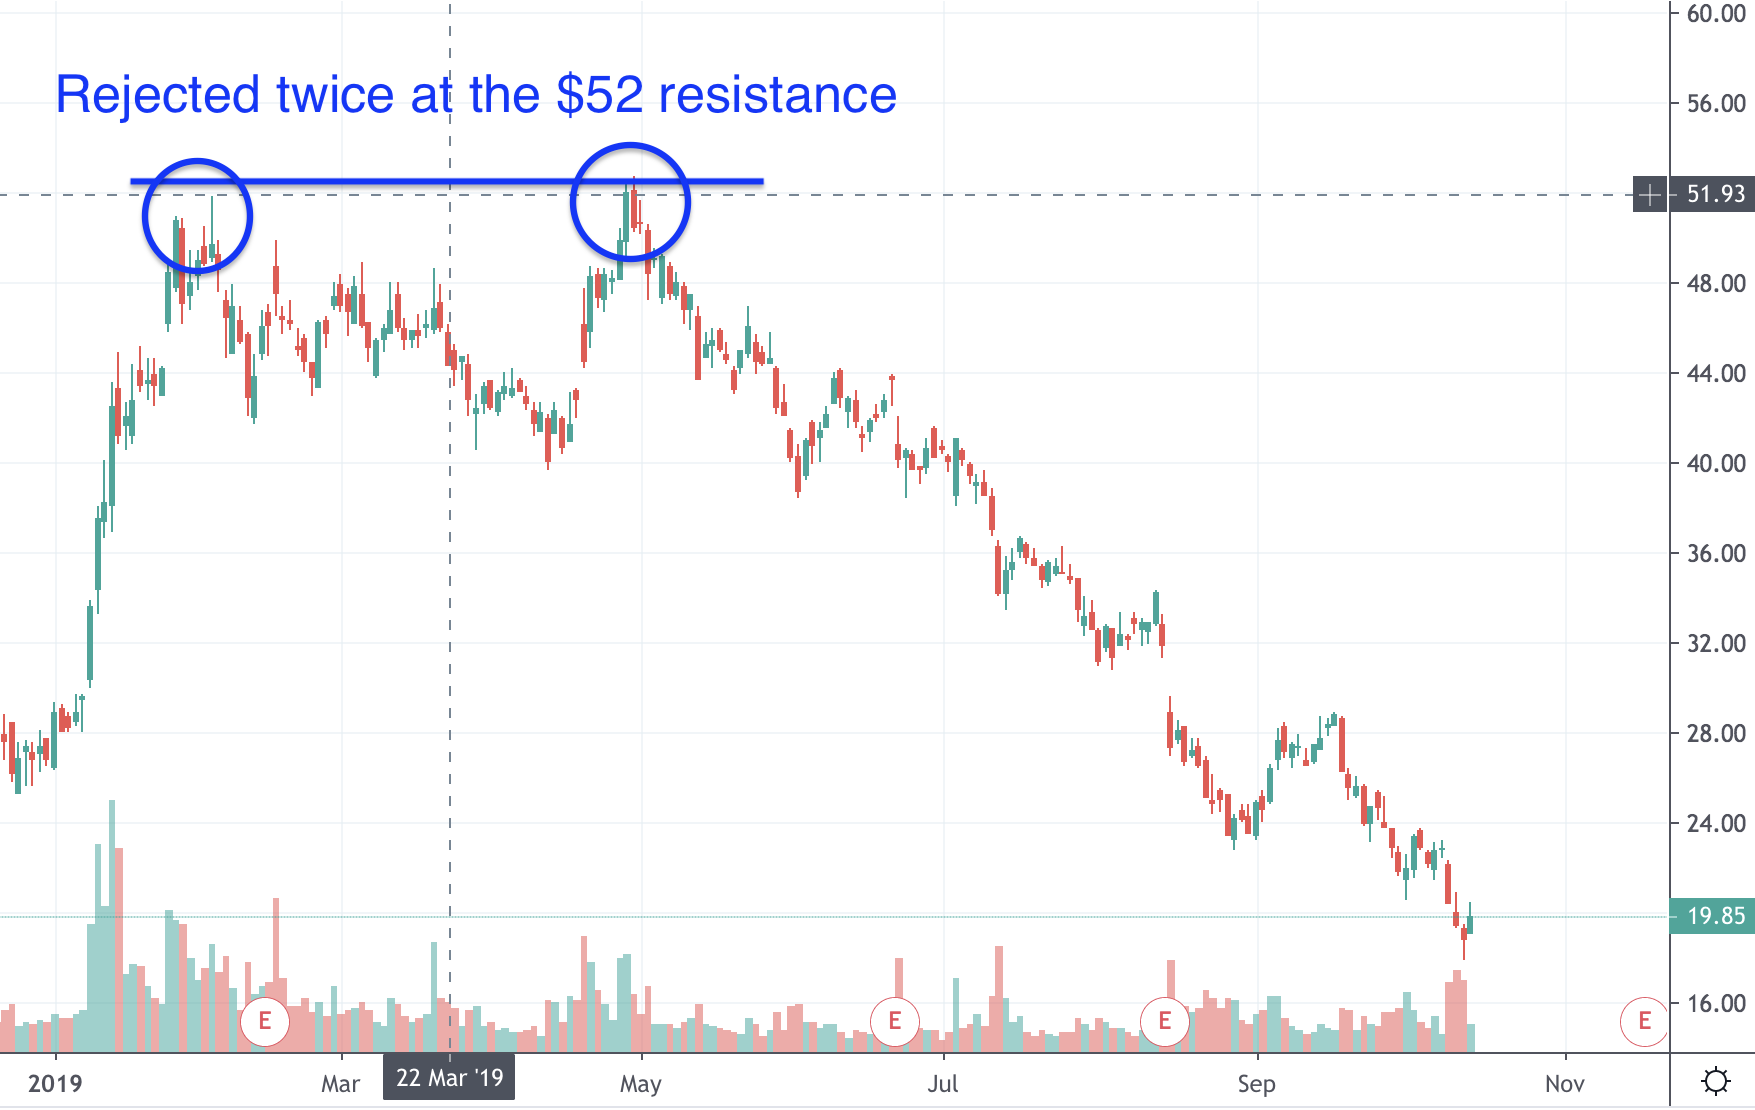
However, the second time it gets rejected a red flag should go up (nothing to do with bull or bear flags either). As seen in the chart, that second rejection resulted in the marijuana stock falling from $52 all the way to $20 and has been unable to recover fully (yet). This is a prime example of a double top chart pattern.
The opposite pattern is known as a “double bottom” and carries the same premise as double tops. For example, a new cannabis stock falls to $10 and then rallies to $12 but ultimately falls back to $10. At this point, this may a buy signal for the stock based on the textbook definition of double bottom technical patterns.
Technical traders are expecting this pot stock to breakout past $12 and complete the reversal. However, as I said above, don’t rely completely on charts as industries like cannabis can shift direction for a number of reasons.
Marijuana Stock Chart Pattern #3: Head And Shoulders
This pot stock pattern takes a little more practice to catch because it usually doesn’t form perfectly. For instance, take Truelieve Cannabis Corporation’s (TCNNF) (TRUL Stock Report) stock chart below. The “ideal” pattern would show the shoulders at relatively equal heights, but this isn’t always the case. Like the double bottom and double top patterns, head and shoulders patterns are also reversal indicators.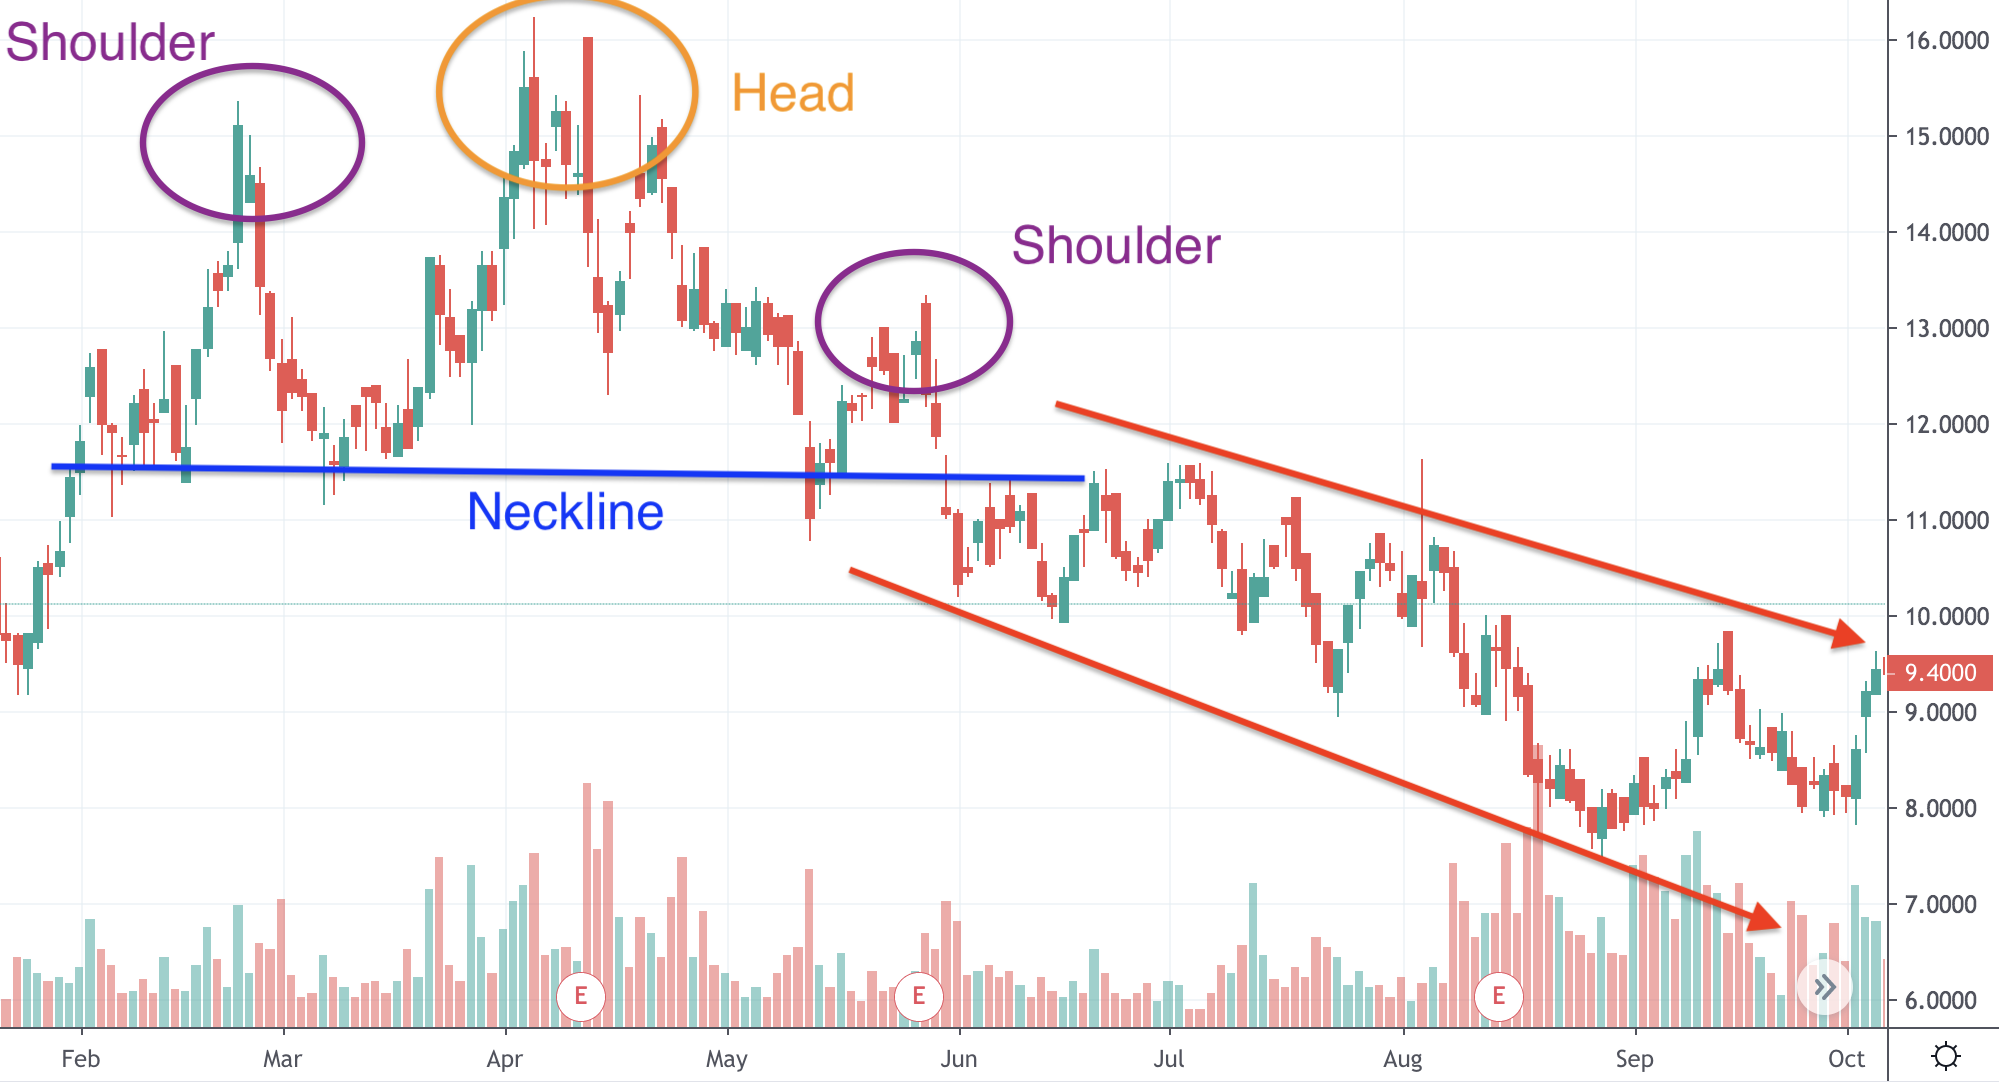
The key price point to be aware of is the neckline. You will notice that the entire pattern sits on that one line. This is important to understand because once the pattern breaks that neckline, a downtrend is expected to insue.
Marijuana Stock Chart Patterns Are Just The Beginning
Keep in mind that these are just a few examples of different chart patterns. What we went over today should give you an idea of:-
What A Head and Shoulders Chart Pattern Looks Like
-
How To Identify A Double Top Chart Pattern
-
What A Double Bottom Chart Pattern Is
-
How To Spot A Bear Flag Chart Pattern
-
How A Bull Flag Chart Pattern Forms
You also have to take into account what’s happening in the cannabis industry. This is important because unlike other sectors, marijuana stocks are still dealing with more than just sector catalysts. Due to the grey area of legalization, government events can have a dramatic impact on how pot stocks perform.
We’re going to do more of these articles with the hopes that you not only get information on marijuana stocks but also info on trading education as well. Hope this one helped and stay tuned for more.
- How To Trade Penny Stocks: 9 Key Strategies To Learn Now
- Are Penny Stocks A Good Investment?
- How To Make Money With Penny Stocks
- How To Buy Penny Stocks On Robinhood
- Penny Stocks For Beginners; How To Buy, Trade, & Make Money
* This article was originally published here


Post a Comment