
Connect the Dots Launch Date Released!

OUR NEW CONNECT THE DOTS ARTICLE LAUNCHES MONDAY 9/16/2019
Well, everyone, it’s almost that time; time to put our 89% Connect the Dots success track record on the line. Over the last 5 years, we at Marijuanastocks.com have selected only 9 companies worthy of our most prestigious marketing coverage known as “Connect the Dots” (CTD).
A CTD marketing campaign consists of several articles and a full-fledged marketing/advertising campaign for a publicly-traded cannabis company. And 8 of the 9 companies we profiled have gone on to provide massive gains for our readers. In fact, 3 gained over +1,000% and another 3 gained over +100%. But even with those potentially life-changing gains, now is time for perhaps our most important CTD profile ever.
But first, let’s take a look at a history of our successful Connect the Dots campaigns:
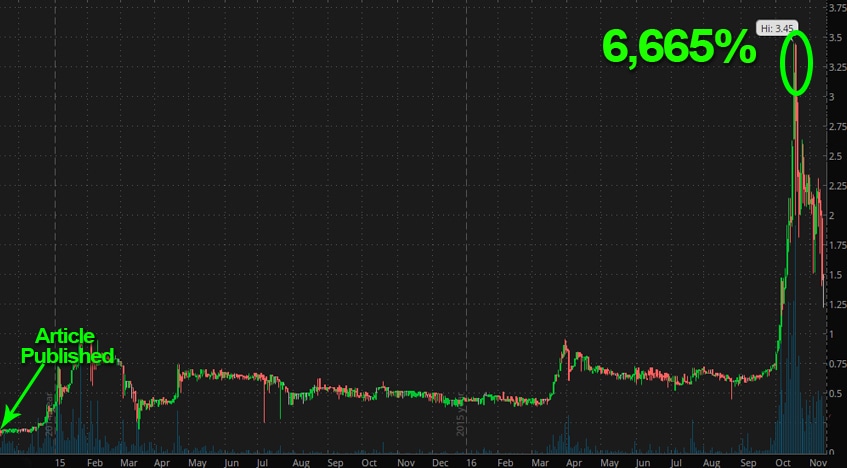
CGRW (BZCN) Intro Date: Oct 22, 2014
- Open Price: $0.051
- High Date: Jan 27, 2015
- High Price: $1.05
- 1,959%% Gain Open to High
- NOTES: After moving sideways for most of 2015, it ran to an all-time high in 2016 of $3.45 on Oct 18, 2016, which ultimately saw a 2-year run of 6,665%
————————————
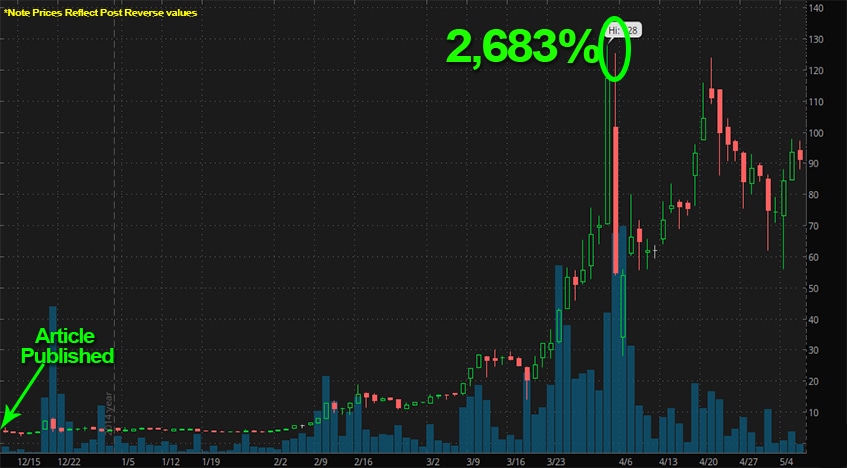
RMHB (THCZ) Intro Date: Dec 18, 2014
- Open Price: $0.23
- High Date: April 1, 2015
- High Price: $6.40
- 2,683% Gain Open to High
- NOTES: These prices reflect historic prices after the company did reverse splits over the years.
————————————
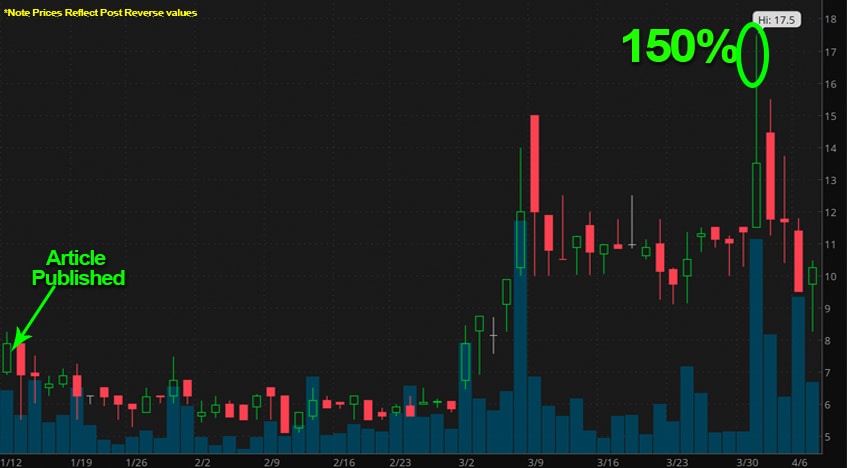
GTBP (OXIS) Intro Date: Jan 12, 2015
- Open Price: $7
- High Date: March 31, 2015
- High Price: $17.50
- 150% Gain Open To High
- NOTES: Prices reflective of reverse splits done over the years. It has also been covered several times since then and has seen intermittent rallies of 100%+ on multiple occasions.
————————————
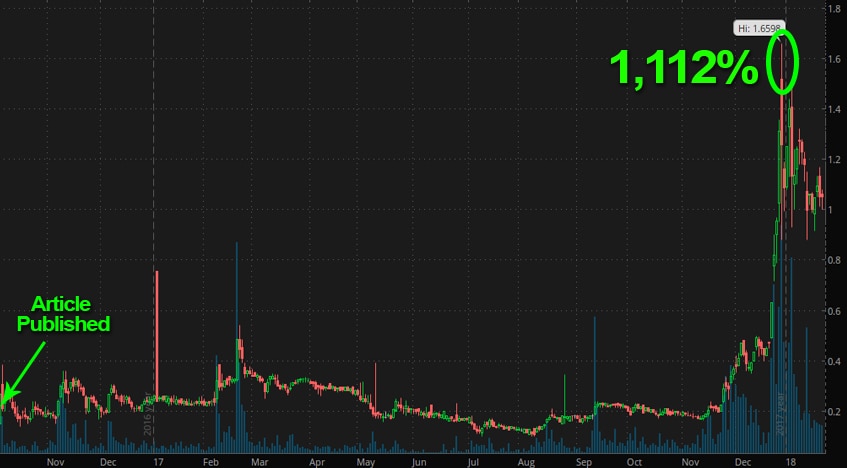
FFRMF Intro Date: Oct 4, 2016
- Open Price: $0.137
- High Date: Feb 22, 2017
- High Price: $0.5412
- 295% Gain Open to High during the initial period we introduced the company
- NOTES: After pulling back in 2017, it ran to all-time highs on Dec 28, 2017, of $1.6598, which ultimately saw a run of 1,112%
————————————
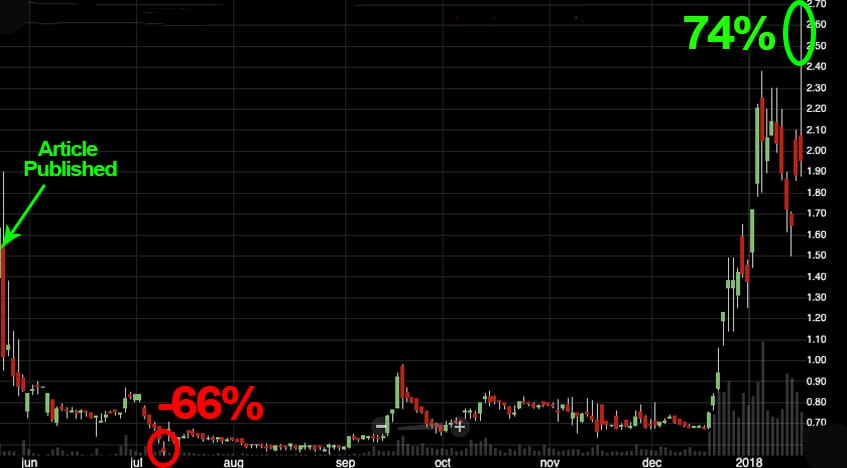
CBWTF (AKA Auxly Cannabis but was Cannabis Wheaton originally) Intro Date: May 23, 2017
- Open Price: $1.55
- Was immediately slammed to lows of $0.52 during the month to follow… a loss of 66%
- Ultimately ended up recovering at the end of 2017 and hit all-time highs of $2.70
- High Date: Jan 17, 2018
- High Price: $2.70
- 74% Gain Open To High over that full years’ time
————————————
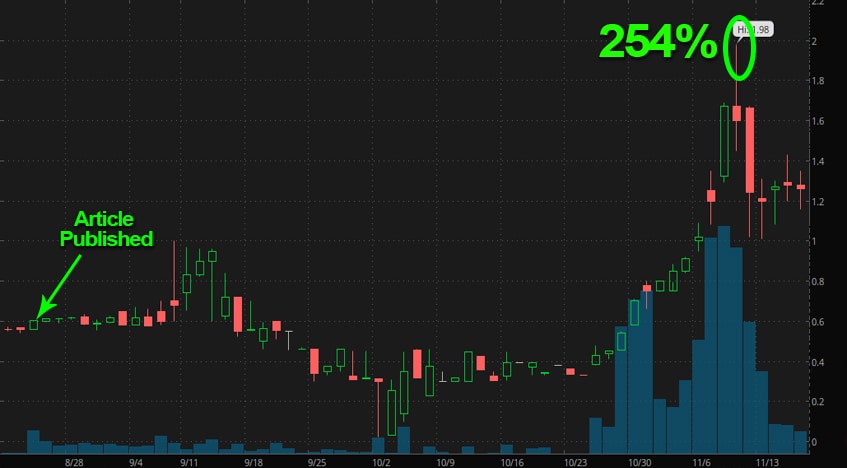
ICNAF (CRPGF) 1 Intro Date: Aug 23, 2017
- Open Price: $0.5582
- High Date: Sept 8, 2017
- High Price: $1
- 79% Gain Open to High during the initial period we introduced the company.
- NOTES: After pulling back in 2017 and recapping on it again in October it ran to all-time highs on Nov 9, 2017, of $1.98, which ultimately saw a run of 254%
————————————
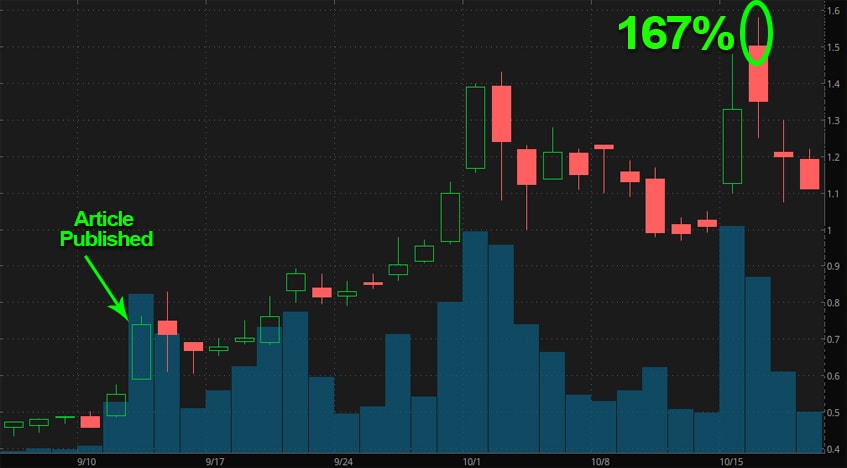
ICNAF 2 Intro Date: Sept 12, 2018
- Open Price: $0.5914
- High Date: Oct 16, 2018
- High Price: $1.58
- 167% Gain Open to High
————————————
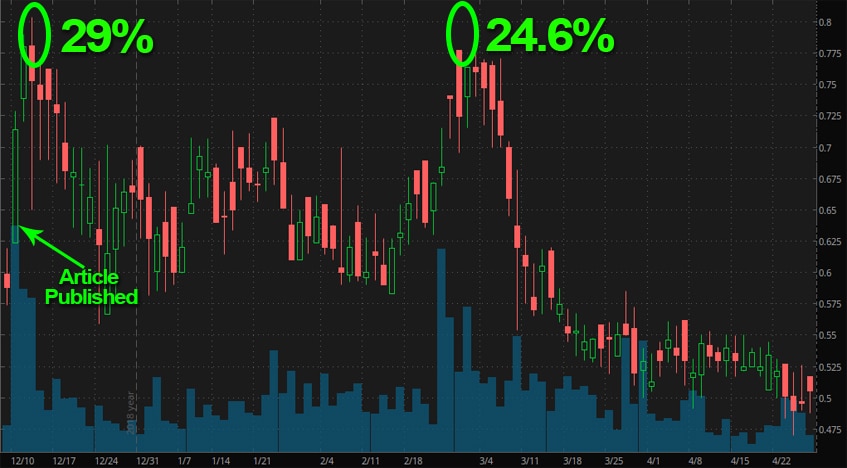
PHGRF Intro Date: Dec 10, 2018
- Open Price: $0.6235
- High Date: Dec 13, 2018
- High Price: $0.77
- 23.5% Gain Open to High
- NOTES: Pulled back to $0.5587 on Dec 24, 2018, and bounced back to highs of $0.777 On Feb 27, 2019, for another move of 39%.
You may be wondering with such a strong track record, why is this CTD so important? What makes this time so special? Because even though we sport an amazing 89% success rate going 8 for 9, the 1 that went wrong, went really wrong. And it doesn’t sit well with us, at all. That 1 also happens to be our most recent CTD feature introduced this past April. And in the words of the great Eddie Murphy, we believe in the, “What have you done for me lately?” mentality.
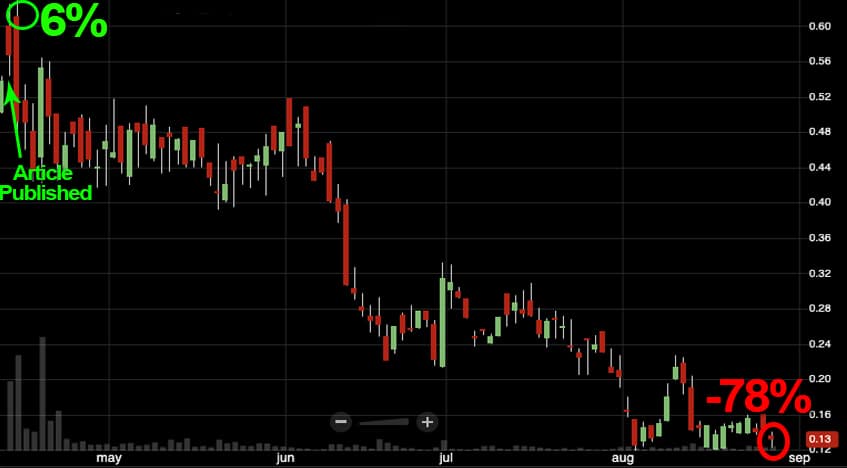
Now let’s take a look at the 1 bad apple in the bunch, Nabis Holdings Inc.
Nabis Holdings Inc. Intro Date: Apr 11, 2019
- Open Price: $0.5995
- High Date: Apr 12, 2018
- High Price: $0.634
- 6% Gain Open to High
- NOTES: It has fallen to recent levels of 0.13…. A decline of 78%, open to recent closing prices
This is why we are pulling out all the stops for this CTD. After the recent failure, we regrouped as a team and put together plans to ensure something like that doesn’t happen again. We truly believe timing had a lot to do with it. Ever since the birth of the cannabis market, summer months have been slow with the industry typically experiencing a pullback.
So, announcing a new CTD in the month of April just ahead of the summer lull was, in hindsight, a mistake. That is part of the reason why we are gearing up to release our most important CTD ever at the forefront of the fall season.
Historically, the fall season has been a bullish time for the cannabis market with many huge runs taking place during Q3/Q4. That is why we have chosen this time of year to announce our next CTD. We want to introduce this company to you, our readers, just ahead of what could be another cannabis market bull run. This time, our timing could be absolutely perfect.
And as you already know, transparency and disclosure are everything to us. We go above and beyond to earn your trust, and more importantly, to keep it. We are going to be paid a large sum of money for this new CTD marketing campaign, which will be disclosed to our readers.
And we plan on spending most of it on high-profile and top-tier financial websites and communities to ensure we reach the largest, targeted audience possible. We are going to advertise on sites like MarketWatch.com, Yahoo Finance, Forbes.com, MSN Money, CNN, Barrons, NASDAQ.com and more. We believe strongly in the potential packed in this budding company and are confident the investing public and audience on such websites will agree.
Marijuana Stocks Getting Down To Brass Tacks
You, our audience, have supported us from the very beginning and it prides us to uncover and bring to your attention tremendous opportunities in the growing cannabis industry. Most online publications would be happy with an 89% track record and would simply brush the 1 loss under the rug.But not us. We are determined to come back guns blazing with this next CTD feature and get back to the +1,000% and +100% gains you are used to. It’s redemption time ladies and gentlemen. So, get ready and be on the lookout for more updates regarding the release date for our most important CTD piece ever.
The post Connect the Dots Launch Date Released! appeared first on Marijuana Stocks | Cannabis Investments and News. Roots of a Budding Industry.™.
* This article was originally published here


Post a Comment