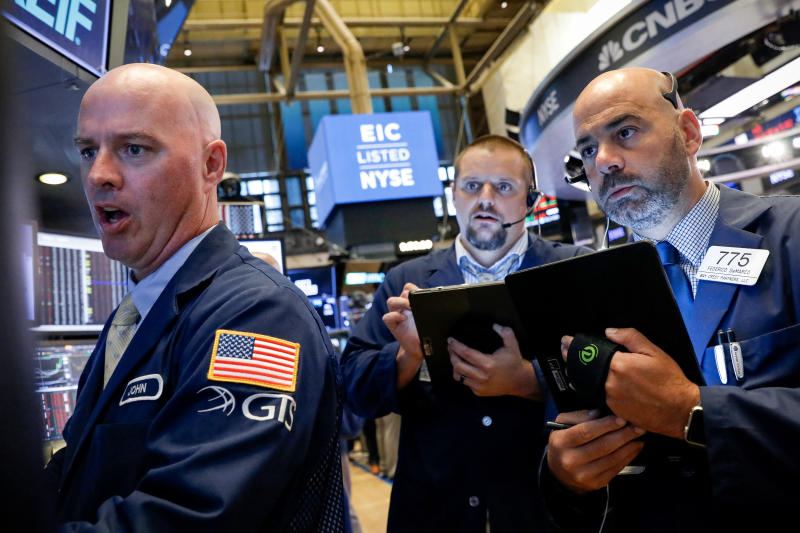
Stock market news: August 8, 2019
U.S. stock futures edged up slightly Thursday morning after China’s central bank fixed the yuan at a stronger-than-expected rate against the U.S. dollar, and after new Chinese economic data signaled less weakness in trade than had been anticipated.
Gold prices ended their march higher and U.S. Treasury yields stemmed declines, after the 10-year yield fell below 1.6% for the first time since 2016 on Wednesday.
Here were the main moves in the market, as of 7:54 a.m. ET:
- S&P 500 futures (ES=F): +0.25%, or 7.25 points
- Dow (YM=F): +0.14%, or 37 points
- Nasdaq (NQ=F): +0.43%, or 32.35 points
- 10-year Treasury yield (^TNX): +1.9 bps to 1.712%
- Gold futures (GC=F): -0.67% to $1,509.40 per ounce
- U.S. dollar to onshore Chinese yuan rate (CNY=X): +0.3304% to 7.0454
The People’s Bank of China (PBOC) set the yuan’s daily fixing at 7.0039 per U.S. dollar on Thursday. This marked the first time since 2008 that the official reference rate was weaker than 7. However, this was still stronger than the 7.0156-per-dollar rate consensus economists had been expecting, indicating China’s central bank was working to stabilize the yuan.
The strength of the Chinese yuan against the dollar remains closely monitored after the PBOC stopped defending the psychological 7-per-dollar level for the first time in over a decade on Monday, sending global markets into a tailspin. The U.S. Treasury officially labeled China a currency manipulator earlier this week.
Meanwhile, new data from China’s customs administration showed that the country’s exports grew in July by the most since March, and imports fell by a less-than-expected degree. The results pointed to some recovery for China’s export-heavy economy even amid escalating trade tensions with the U.S.
With exports up 3.3% in July over last year and imports down 5.6%, China’s trade surplus came in at $45.1 billion for the month, better than the $40 billion surplus expected. China’s exports to the U.S. shrank, however, after the Trump administration hit goods from the country with a higher rate of tariffs following an announcement in May. China’s shipments to Europe, South Korea, Taiwan, and Southeast Asia picked up in July.

Ongoing uncertainty around the outlook for U.S.-China trade relations and global growth made for choppy trading throughout the week, at the start of a month already known for being historically weaker for U.S. equities.
“The S&P 500 has shed more than 5% over the past six trading days ... spurred by the Fed’s decision to decrease interest rates, and a resumption of U.S. and China tariff saber rattling,” BMO Capital Markets’s Brian Belski wrote in a note published Wednesday evening. “This much we know and can all apply ‘blame’ for the global stock market weakness. However, we believe investors once again lack perspective and are feeding on fear, rhetoric, and innuendo instead of facts.”
Other market pundits said recent market volatility could generate an investing opportunity. The threshold for an “investable bottom,” however, requires a relatively steep pullback, according to Datatrek co-founder Jessica Rabe.
“Many investors look for violent one-day declines for attractive buying opportunities, but it takes a truly uncommon event like a down 4% day to signal an investable bottom,” Rabe wrote in a note. “The VIX (volatility index) has peaked the most in August and October, so the next three months is the most likely time it could happen, especially with trade and Fed related headline risks.”
“If you can hold on through incremental volatility, history has shown the S&P usually recovers by double digits after a year,” Rabe added.
The VIX (^VIX), a closely watched gauge of fear in the markets, jumped as high as to 24.81 intraday on Monday, the highest reading since January. The VIX has since pared gains and closed at 19.49 on Wednesday, but remains at a higher level than had been seen for much of the year-to-date.
For more articles like this, please visit us at Yahoo Finance
For more articles like this, please visit us at Yahoo Finance


Post a Comment