
Chart Patterns: Head and Shoulders #1
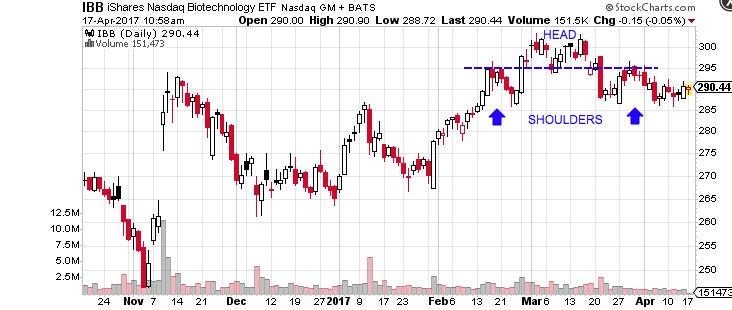
The Head and Shoulders is a reversal chart pattern that indicates a likely reversal of the trend once it’s completed. A Head and Shoulder Top is characterized by three peaks with the middle peak being the highest peak (head) and the two others being lower and roughly equal (shoulders). The lows between these peaks are connected with a trend line (neckline) that represents the key support level to watch for a breakdown and trend reversal. A Head and Shoulder Bottom – or Inverse Head and Shoulders – is simply the inverse of the Head and Shoulders Top with the neckline being a resistance level to watch for a breakout higher.

Transparent Traders is a group that networks stock traders of all experience levels. We offer an 8 hour free stock trading course for those who are wanting to learn, or for those who want to take their trades to the next level. We are successful stock traders who believe in giving back to the trading community. Facebook Group: https://www.facebook.com/groups/20987... Discord Server for Transparent Traders: https://discord.gg/KPmvwuy James Mason's YouTube Channel: https://www.youtube.com/channel/UC39b... Transparent Traders Website: https://www.transparenttraders.me WeBull Free Commision, Sign Up Here: https://act.webull.com/invitation/us/...
MentorShip Program: https://www.transparenttraders.me/p/own-chaos-mentorship-program.html


It only takes such a great stock education for a beginner like me to understand what the chart pattern head and shuolder means. It would be very difficult to just understand by myself.
ReplyDeleteSince Im not a trader, I have no idea what a Head and Shoulders chart is. But this post has explained the details well. Good job!
ReplyDeleteThis free stock course has not only enlightened me on chart patterns but also aroused my curiosity about stock trading. I will definitely give it a second thought and see how it goes.
ReplyDeleteThe stock education I'm getting on this website is priceless..keep the information flowing...
ReplyDeleteIt takes an expert in the stock market to give such an analysis of the penny stock market. Such investing tips can make all the difference.
ReplyDeleteToo many terms that I cannot help but be confused. What does a reversal chart pattern has anything to do with head and shoulders? This is stocks not anatomy.
ReplyDeleteHow long is your free stock course? Do I need to provide credit card details?
ReplyDeleteokay i see a lot about investing tips but sadly i'm not following. Okay what is required for me to gain some of this stock education? please help out
ReplyDeleteWhat does a reversal chat pattern mean in terms of how you should focus your investments? I would like to know how to apply it in real life trading.
ReplyDeleteThis can really help day traders in penny stocks who look for certain trends. It's a treasure trove of information.
ReplyDeleteYet another valuable tidbit to add to my stock education. Thanks a lot for sharing.
ReplyDeleteIt's better to analyze chart patterns and make your own decisions than relying on investing tips from others. Some people may mislead you into making the wrong decision.
ReplyDeleteThe reversal chart pattern presents a good opportunity to make a good trade and you can tell what the trend will look like. A deep understanding of these trends is very important.
ReplyDeleteThis is why stock education is really important before investing. All of this chart must be studied and understood before money is made.
ReplyDeleteDo you believe that all of these patterns naturally occur. Or are they all caused by similar company standards etc? Would love to know more about the different patterns.
ReplyDelete