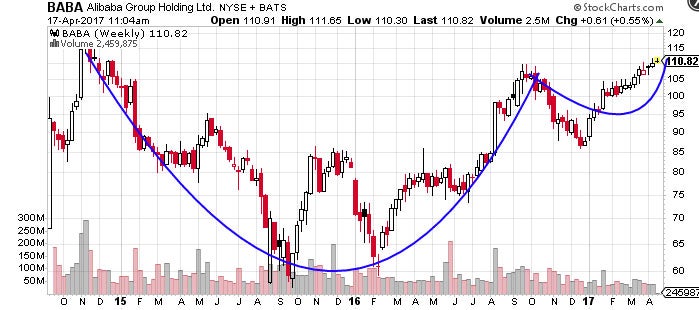
Chart Patterns: Cup and Handle #2
The Cup and Handle is a bullish continuation pattern where an upward trend has paused, but will continue when the pattern is confirmed. The ‘cup’ portion of the pattern should be a “U” shape that resembles the rounding of a bowl rather than a “V” shape with equal highs on both sides of the cup. The ‘handle’ forms on the right side of the cup in the form of a short pullback that resembles a flag or pennant chart pattern. Once the handle is complete, the stock may breakout to new highs and resume its trend higher.


I have seen this cup and handle in various chart patterns before but didn't quite understand what they meant. This stock education is very helpful.
ReplyDeleteThe concept in penny stocks is novel to me..thanks a bunch..Great share
ReplyDeleteThese chart patterns can be quite confusing if you are new in stock trading. Such a detailed analysis of an expert in the industry has helped a lot.
ReplyDeleteUnderstanding such a chart pattern as this can play a great role in ensuring whether you succeed in the stock market or not. It contains one of the best investing tips in the market you could ever find.
ReplyDeleteVery interesting. I have actually seen the chart patterns before and glad to know the meaning behind it and glad to know its not very complicated.
ReplyDeleteAt least this is more direct concept wise compared to the previous one. For a free stock course. I think this is in an advance level.
ReplyDeleteI like this stock education because it really enlightening one on when to invest since it when Once the handle is complete, the stock may breakout to new highs and resume its trend higher.with this one is sure of succeding.
ReplyDeleteOkay personally i have never heard of this cup and handle trend but it looks very interesting. Thanks for the investing tip now the problem is i just don't know how to use the tip.
ReplyDeleteIdentifying and taking advantage of chart patterns such as this can really help turn a good profit. I like your concise description of these charts.
ReplyDeleteI came across this pattern in my stock education but I didn't quite understand it. Your explanation just made it clear to me. Much thanks!
ReplyDeleteIf a trader can identify these patterns as they start showing during penny stocks trading they can make a good sum. I hope to be able to do that one day.
ReplyDeleteThe free stock course gives a good foundation to understanding these patterns. Anyone who doesn't fully grap these charts should give it a try.
ReplyDeleteThis is by far the most interesting of all the chart patterns. It's very unpredictable and dynamic.
ReplyDeleteWow, I've seen this before as well but never thought of it as a pattern. There are so many different little patterns within the market, it just takes time to figure them out. Thanks for sharing this!
ReplyDelete