
Ascending Triangle Trading Strategy
The ascending triangle trading strategy is an easy method to capture breakouts inside a trend. In order to confirm the breakout we’re going to use the RSI tool which is a momentum-based indicator.
Since the price usually contracts inside the ascending triangle pattern, at one point either the bulls or the bears must win. With the RSI indicator in our trading arsenal we can determine in advance who is going to win this battle.
How it works?
Let’s get it step-by-step:
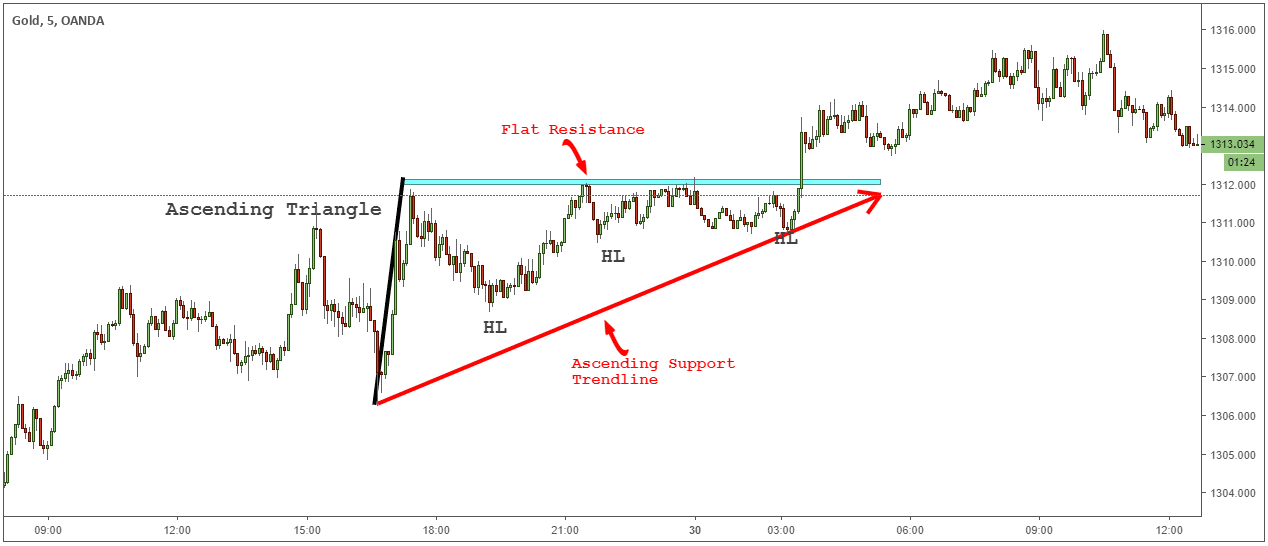
Step #1: The Ascending Triangle must Have a Flat Resistance and a Rising Support Trend-line
The two elements of a good ascending triangle pattern are:
- A flat resistance that it’s hit multiple times. The more a resistance line is tested, the more likely it will eventually fail to hold as resistance level.
- The second element is a rising support trend-line that connects the successive higher lows inside the ascending triangle formation.
See the ascending triangle chart below:
Next, we’re going to make use of the RSI technical indicator.
See below:
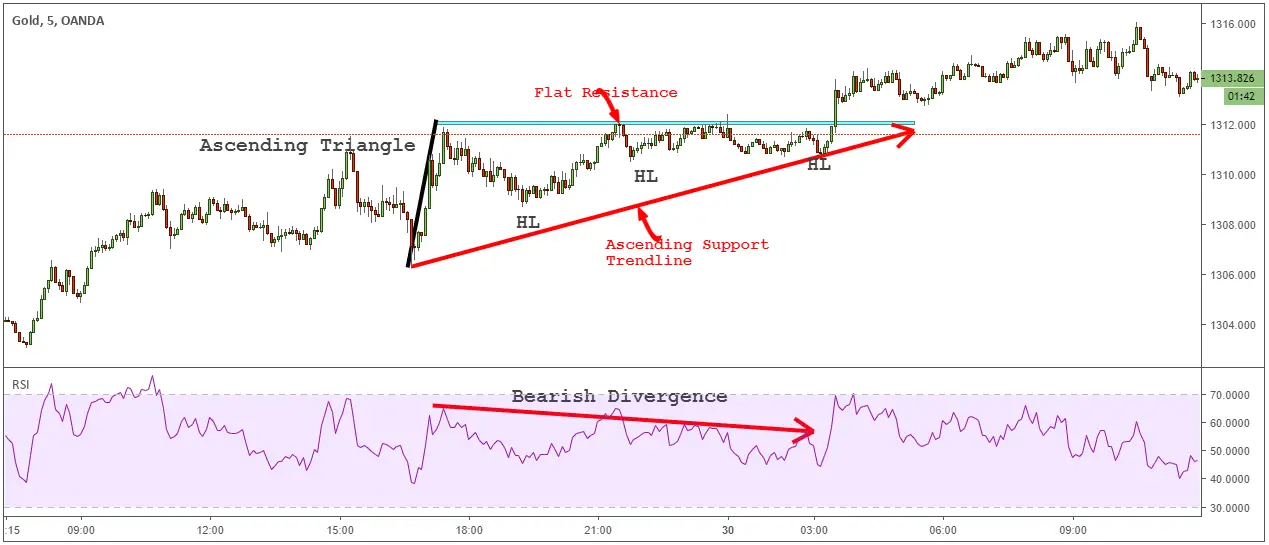
Step #2: Apply the RSI 20-periods on your Chart
Normally, the price action consolidates inside the ascending triangle formation.This means that there is an ongoing battle between the bulls and the bears. Assessing who is going to win this battle can be done by looking the RSI readings.
Before the breakout to come we can look at the action inside the consolidation to decide if it’s worth taking the breakout or it’s better to just wait for another trade.
What we want to see is momentum decreasing after each successive retest of the flat resistance level. Basically, we look to see a bearish divergence developing on the RSI indicator.
See the ascending triangle chart below:
Now, before buying the breakout we need to check one more thing.
See below:
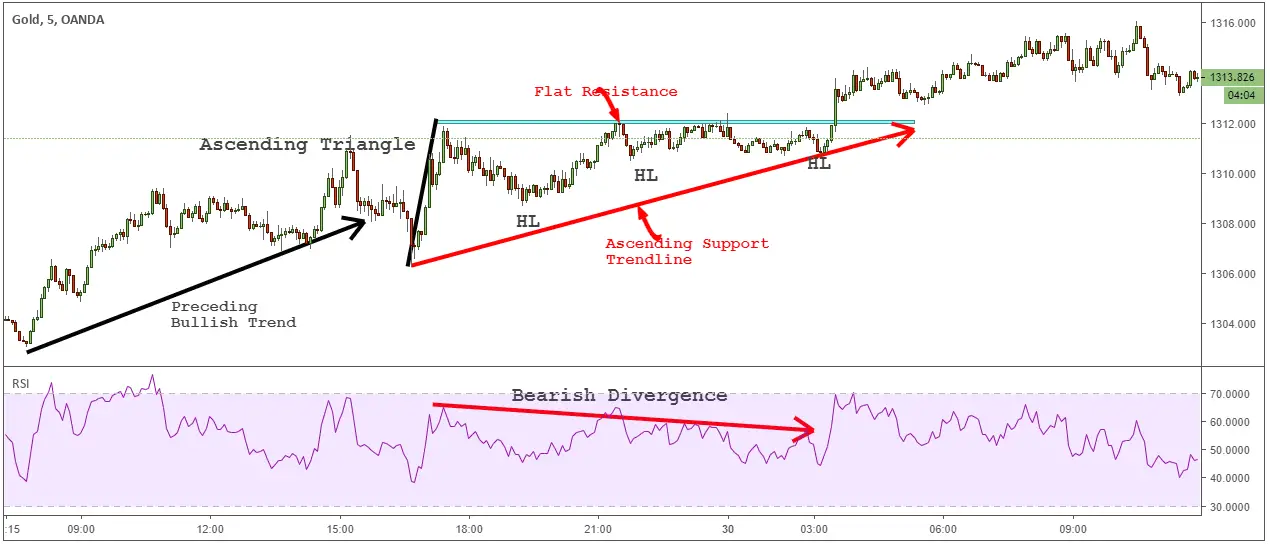
Step #3: Check if prior to the Ascending Triangle we have a bullish trend
As a continuation pattern, naturally we need a preceding trend. In the case of the ascending triangle, which is a bullish pattern, we need to have a prior uptrend.
If we have a prior uptrend, it suggests that the breakout has a higher probability to happen on the upside.
See the ascending triangle chart below:
Last step is to define our entry trigger point and to measure our profit targets.
See below:
Step #4: Buy as soon as we break above the flat resistance level
With continuation patterns, the best strategy is to buy straight away with the breakout. If we wait too much we end up leaving some of the available profits on the table.
We already have so many confluence factors that confirm the breakout that it’s useless to wait for more confirmation. After all we want to anticipate the breakout and be ahead of the crowd.
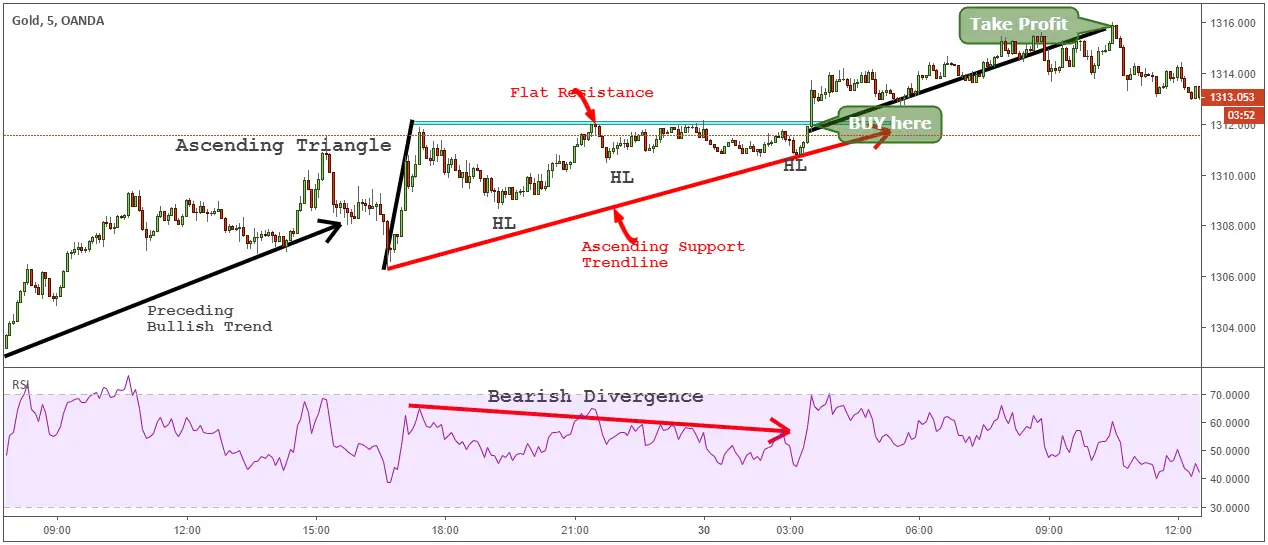
For the take profit strategy, we’re going to use our favorite measuring technique. This is a dynamic strategy that it’s based on the actual price rather than random number.
To find the profit target, simply the the high and the low of the ascending triangle formation and add that measurement to the breakout level which will give you the ideal target for this continuation pattern.
Conclusion – Ascending Triangle Formation
The ascending triangle formation is a very powerful chart pattern that exploits the supply and demand imbalances in the market. You can time your trades with this simple pattern and ride the trend if you missed the start of the trend.
Many technical analysts trade the breakout without first taking the time to understand what goes behind the scene. With the ascending triangle we can have a perfect head start, and see the trading opportunity before it happens. So, being able to recognize the ascending triangle pattern can be a valuable tool that you can use to identify profitable trades.


Post a Comment