
What is Support and Resistance Levels in Stock Trading?
 What is Support and Resistance Levels in Stock Trading?
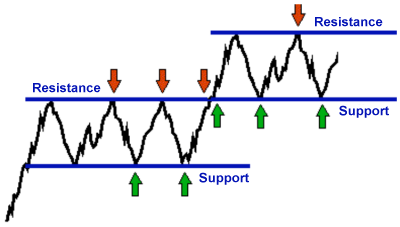
Support and resistance are specific price areas or price levels which either support prices on declines in up trends or which resist prices on rallies in down trends.
In an up trend, short term and day traders will attempt to buy at support or at levels of support. In a down trend, short term and day traders will attempt to sell at resistance levels or in resistance areas.
If support and resistance levels cannot be determined, then you cannot define concise levels in which to establish entry or exit positions in your specific trade. It is of utmost importance for traders to develop effective strategies and methodologies for calculating support and resistance levels. These levels can be determined with the use of various trading tools like Point and Figure charts, Fibonacci numbers and Gann angles.
Day traders is in a definite advantage when it comes to the use of support and resistance levels, in as much that the day trader's trade normally end when the trading day is over and if a bad trade or decision was made based on support or resistance levels it will not be repeated in the next trading day.
Determining support and resistance levels are somewhat different for the day trader than the position trader. This is because support and resistance levels for the day trader must be closer to the current market price that they are for the long term or position trader. Markets can only drop so far in one day, and consequently the determination of support and resistance levels by the day trader must be realistic in terms of what can be expected - however this does mean that day traders must be willing to use realistic technical support and resistance levels in order to establish their positions.
The following rule may appear very simple, yet it is enormously effective at isolating support and resistance levels and can be applied profitably in any market:
1. Follow a 3-day moving average of the highs, and a 3-day simple moving average of the lows.
2. Take the 3-day moving average of the highs to act as your resistance level, and the 3-day moving average of the lows to act as your support level.
3. Add a filter by drawing in the support of the lows if the trade has made a 3-day high in say, the last 3 days (you can use four or five days, depending on your trading methodology) This means that you will only draw in the 3-day moving average of the highs if the stock has made a 3-day low in the last three days - this means that you only want to sell when the short term is down.
This is a very simple method of trading stocks and commodities on a daily basis, and if calculated correctly they will work.


Thanks for explaning how support and resistance works, and for sharing the rules
ReplyDeleteI'm not good at math but your explanations are clear and easy to follow. Keep up the good job :)
ReplyDeleteGlad you were able to find the article helpful.
DeleteThis technique is very vital in daily trading of stocks and commodities. I appreciate you making everything clear.
ReplyDeleteJust learn about how support and resistance system works. one should try to follow the high and low days,I think it will be a lot helpful. great tips here.
ReplyDeleteTrading is so confusing. With your explanation, it became easy. Thank you.
ReplyDeleteI try to share anything and all that will be useful and helpful to others.
DeleteAdding a filter and utilizing moving averages sounds like useful ways to determine profit margins. I can see how there is a lot of skill involved with trading stocks on a daily basis.
ReplyDeleteI am a bit confused but at least I got the gist of all this. To see other aspects of stocks other than increase and decrease of numbers is new to me. The concept that is.
ReplyDeleteI usually do not like looking at number but the way you explained it is very simple. I think I would be able to understand all about it if I read a few more about it. Thanks.
ReplyDeleteI only saw trends but I didn't know exactly what they meant. I'm used to time series analysis but stocks is actually coming to interest after visiting your site.
ReplyDeleteWhen it comes to trading,you are a guru..you have so much knowledge about how this things work..I find your write up helpful.. Keep writing...
ReplyDeleteTrading is really complex and honestly, it's all Greek to me. However, I like how really make things simpler to understand. Thank you for taking time out to explain these things. It's really a godsend.
ReplyDeleteThis is very helpful especially to novice like me. You did an awesome job of making me understand resistance and control of stocks. Thanks for this.
ReplyDeleteYour very welcome. Feel free to reach out with any questions.
DeleteI love this blog!! The flash up the top is awesome!! Compare FSA Brokers
ReplyDelete